Satellite Communications

Wireless Backhaul via Satellite

Wireless Backhaul via Satellite, 17th Edition

PUBLISHED: February 2023

Available Licenses: Corporate: $8,995

  • Report Summary
  • Key Features
  • Table of Contents
  • Supporting Articles

NSR’s Wireless Backhaul via Satellite, 17th Edition (WBS17), the industry’s longest-standing analysis of the Satellite Backhaul and Trunking backbone, provides comprehensive forecasting of Market Opportunity by Segment, Capacity & Region.

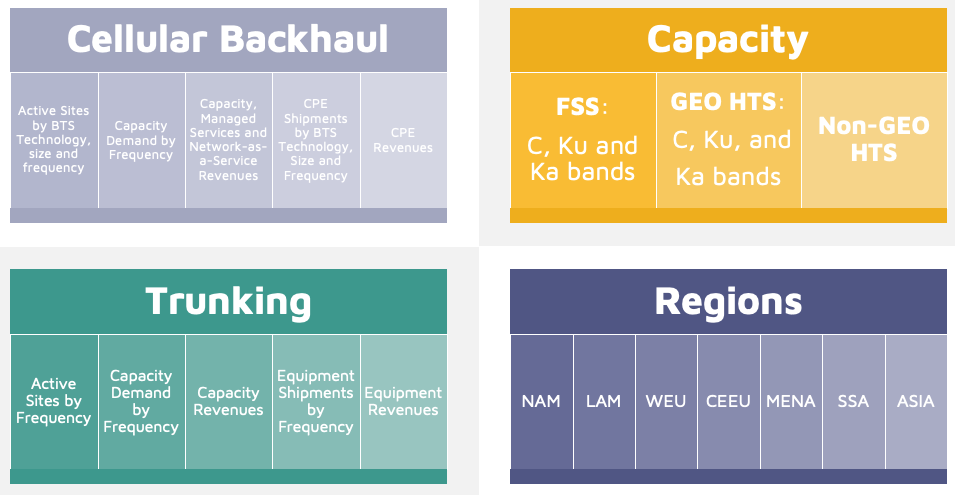
WBS17 provides strategic insight of the rapidly evolving Mobile Backhaul and Trunking segments. The report assesses installed sites, capacity requirements and equipment shipments as well as capacity, service and CPE revenues across seven regions. NSR’s Wireless Backhaul via Satellite, 17th Edition builds a complete picture of trends, drivers, and challenges behind each major category of backhaul connectivity-services using a fixed satellite antenna across base station technologies (2G, 3G, 4G and 5G) and cell sizes.

Key questions are answered in this report:

  1. What is the addressable market opportunity for Satellite in cellular backhaul and trunking segments?
  2. How does satellite solution compare to microwave and fiber for CAPEX and OPEX?
  3. What is the revenue opportunity and capacity demand?
  4. What is cost of satellite capacity and equipment?
  5. What market trends exist in the seven regions and the global outlook?
  6. What is the future of GEO vs Non-GEO solutions in the market segments?

Who Should Purchase this Report?

  1. Satellite Operators
  2. Equipment Vendors
  3. Service Providers
  4. Mobile Infrastructure Operators
  5. Innovation and Industry Agencies
  6. Investment Community

NSR Difference

As the market grows and transforms, NSR’s data and forecasts provide a clear vision of the Backhaul markets and the Satellite role in the 5G ecosystem. NSR’s Wireless Backhaul via Satellite, 17th Edition (WBS17) continues to provide an honest assessment of the market in this promising but risky business landscape, serving as an opportunity roadmap for future strategic decisions.

Covered in this Report:

  • New in this Edition– Addressable Market reassessment
  • New in this Edition– Assessment of impact from weak macroeconomic environment
  • Assessment of trends driving growth in each market segment and region
  • Analysis of 5G potentials for Satellite Backhaul and Trunking
  • Forecasting of revenue opportunity for established and new business models such as managed services and network as a service
  • Financial model assessment of Satellite Backhaul CAPEX and OPEX comparison to microwave and fiber.
  • Projections of site deployment by BTS technology and cell size
  • 10-year forecasting of Capacity Requirements across Segment

Report Segmentation:


Companies included in this Report:

ABS, Africa Mobile Networks, Altice, Amazon, Andesat, Antrix/ISRO, APT Satellite, ArabSat, AsiaSat, AT&T, Avanti Communications, Axess, Broadpeak, China Satcom, Claro, Comtech, EE, Digicel, Entel, Ericsson, Eutelsat, Facebook, Gazprom Space Systems, Gilat, Globe Telecom, Hispasat, Huawei, Hughes, ST Engineering iDirect, Intelsat, IP.ACCESS, Kacific, KDDI, MEASAT, MTN, NBN, Neotion, Nokia, Novelsat, NuRAN, O3b, OneWeb, Optus, Orange, Parallel Wireless, Quadrille, Reliance Jio, SES, SKY Perfect JSAT, Softbank, Spacecom, Spacebridge, Starlink, Speedcast, Sprint, Star One, Talia, Telefonica, Telenor, Telesat, Thaicom, TIM, T-Mobile, UHP, Verizon, ViaSat, Vodacom, Vodafone, Xiplink, YahSat, and ZTE.

Other Reports Related to this Subject Matter

5G via Satellite
M2MIoT


Table of Contents

Introduction and Definitions

Executive Summary

  1. Global Overview
    1. Global Analysis
    2. Addressable Market
    3. Bottom Line
  2. Wireless Backhaul
    1. Scope and Definitions
    2. Executive Summary
    3. Major Market Trends and Global Figures
      1. Active Sites
      2. Capacity Demand and Revenues
      3. Equipment and Modem Market Share
      4. Bottom Line
    4. Financial Models
      1. GEO ROI Case Study (Macrocell)
      2. GEO ROI Case Study (Smallcell)
      3. Elasticity
    5. Regional Forecast
      1. North America
      2. Latin America
      3. Western Europe
      4. Central and Eastern Europe
      5. Middle East and North Africa
      6. Sub-Saharan Africa
      7. Asia
    6. Comparison with Previous Edition
  3. Trunking
    1. Scope and Definitions
    2. Executive Summary
    3. Major Market Trends and Global Figures
      1. Active Sites
      2. Capacity Demand
      3. Equipment Forecast
      4. Bottom Line
    4. Regional Breakdown
      1. North America
      2. Latin America
      3. Western Europe
      4. Central and Eastern Europe
      5. Middle East and North Africa
      6. Sub-Saharan Africa
      7. Asia
    5. Comparison with Previous Edition

ANNEX Methodology and Assumptions

List of Exhibits

Executive Summary

  • Active Backhaul Sites by BTS Technology
  • Total Backhaul Capacity Demand
  • Global Backhaul Capacity Revenues
  • Global Backhaul CPE Revenues
  • Global Trunking In-Service Units
  • Total Trunking Capacity Demand
  • Global Trunking Capacity Revenues
  • Global Trunking CPE Revenues
  1. Global Overview
    1. Total Global Sites by Region
    2. Market Share by Application
    3. Total Global Capacity Demand
    4. Total Global Capacity Demand in Gbps
    5. Global Capacity Revenues
    6. CPE Shipments
    7. CPE Revenues
    8. Addressable Market – Population Agglomerations and Throughput
    9. Addressable Market – Global Bandwidth Needs Heat Map
  2. Wireless Backhaul
    1. Active Sites by BTS Technology
    2. Total Backhaul Capacity Demand
    3. Global Backhaul Capacity Revenues
    4. Global Backhaul CPE Revenues
    5. Global In-Service Units
    6. Global Capacity and Service Revenues
    7. Capacity Revenues Evolution
    8. Global Shipments by BTS Technology
    9. CPE Revenues by Region
    10. Cost vs. Traffic for a Generic Base Station and Different Backhaul Technologies
    11. TCO for Different Backhaul Technologies (3G BTS – 2.5 Mbps allocation)
    12. Cost per GB as Data Traffic Increases (20 Km from Backbone Node)
    13. Satellite Becoming More Cost Effective
    14. Long-tail of Cells Traffic
    15. North America Active Sites by Base Station Technology
    16. North America Active Sites by Cell Size
    17. North America Capacity Demand
    18. North America Capacity Revenues Evolution
    19. North America CPE Revenues by Base Station Technology
    20. Latin America Active Sites by Base Station Technology
    21. Latin America Wholesale Capacity Revenues
    22. Latin America Modem Shipments by Base Station Technologies
    23. Latin America CPE Revenues
    24. Western Europe Active Sites by Base Station Technology
    25. Western Europe Wholesale Capacity Revenues by Frequency
    26. Western Europe Modem Shipments by Base Station Technologies
    27. Central and Eastern Europe Active Sites by Base Station Technology
    28. Central and Eastern Europe Wholesale Capacity Revenues by Frequency
    29. Central and Eastern Europe Modem Shipments by Base Station Technologies
    30. Middle East and North Africa Active Sites by Base Station Technology
    31. Middle East and North Africa Wholesale Capacity Revenues by Frequency
    32. Middle East and North Africa Modem Shipments by Base Station Technologies
    33. Sub-Saharan Africa Active Sites by Base Station Technology
    34. Sub-Saharan Africa Wholesale Capacity Revenues by Frequency
    35. Sub-Saharan Africa Modem Shipments by Base Station Technologies
    36. Asia Active Sites by Base Station Technology
    37. Asia Wholesale Capacity Revenues by Frequency
    38. Asia Modem Shipments by Base Technologies
    39. In-Service Units Comparison with previous edition
    40. Capacity Revenues Comparison with previous edition
    41. CPE Revenues Comparison with previous edition
  3. Trunking
    1. Global Trunking In-Service Units
    2. Total Trunking Capacity Demand
    3. Global Trunking Capacity Revenues
    4. Global Trunking CPE Revenues
    5. Global In-Service Units
    6. Global Capacity Demand
    7. Total Trunking Capacity Demand
    8. Global Capacity Revenues by frequency
    9. Global CPE Shipments
    10. Global CPE Revenues
    11. NAM In-Service Units
    12. NAM Capacity Revenues
    13. NAM CPE Shipments
    14. LAM In-Service Units
    15. LAM Capacity Demand
    16. LAM CPE Shipments
    17. WEU In-Service Units
    18. WEU Capacity Revenues
    19. WEU CPE Shipments
    20. CEEU In-Service Units
    21. CEEU Capacity Revenues
    22. CEEU CPE Shipments
    23. MENA In-Service Units
    24. MENA Capacity Revenues
    25. MENA CPE Shipments
    26. SSA In-Service Units
    27. SSA Capacity Revenues
    28. SSA CPE Shipments
    29. ASIA In-Service Units
    30. ASIA Capacity Revenues
    31. ASIA CPE Shipments
    32. In-Service Units Comparison with previous edition
    33. Capacity Revenues Comparison with previous edition
    34. CPE Revenues Comparison with previous edition
Questions about this report? Contact Us