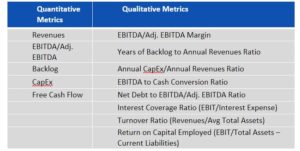
NSR’s Satellite Operator Financial KPIs, 13th Edition (SOF-KPI13) is the industry’s leading resource for the assessment and analysis of financial performance across the Global Satcom market. With more than 13 metrics dissected, SOF-KPI13 examines core aspects of business such as financial performance with Revenue, EBITDA, Debt and Competitive ratios.
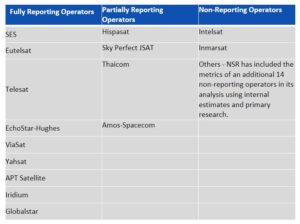
SOF-KPI13 presents the complete Satcom Financial Index of both quantitative and qualitative metrics for 13 operators. Limited metrics are analysed for another 14 non-reporting operators.
Key questions answered in this report:
- How has the industry’s revenues grown in 2022 on a year-on-year basis, and over the last five years?
- Which sectors are driving revenue growth in the global satcom market and which sectors are contracting on a revenue basis?
- Which industry players are the top gainers in 2022 and which are the top losers?
- What are the key financial metrics of leading industry players and how do they rank against each other?
- What is the financial outlook of key industry players?
Who should purchase this report:
- National, Regional and Global Satellite Operators
- Service Providers and Integrators
- Telecommunication and Wireless Operators
- Broadcasters and Pay-TV Operators
- Banks and Financial Institutions
- Private Equity, Hedge Funds and Venture Capital (New Space)
- Satellite Manufacturers
- Regulators and Agencies funding Telecom Research and Development
- Policy Makers
- Strategy Consultancies
- Space Agencies and Defence Organizations
- Launch Service Providers
- Insurers
NSR Difference – What sets this report apart from our competition?
Built on 10+ years of in-house research and innovation in cross-analysing infrastructure, capacity supply, demand, pricing, and funding developments, NSR’s Satellite Operator Financial KPIs, 13th Edition (SOF-KPI13) offers a complete picture of current financial performance trends in the satcom industry. NSR’s latest report offers readers unique insight focused on financial analysis of individual satellite operators on a YoY basis. Leading the future, SOF-KPI13 benchmarks financial performance as well as the anticipated ability to survive, sustain or future-proof growth, keeping readers ahead of the curve.
Table of Contents
- List of Key Abbreviations & Definitions
- Executive Summary
- Chapter 1: Satcom Financial Index
- 1.1 Operational Metrics
- 1.1.1 Revenues
- 1.1.2 EBITDA/Adj. EBITDA and EBITDA/Adj. EBITDA Margin
- 1.1.3 Backlog & Years of Backlog to Annual Revenues Ratio
- 1.2 Debt Position & Solvency Metrics
- 1.2.1 Net Debt to EBITDA/Adj. EBITDA Ratio and Interest Coverage Ratio
- 1.3 CapEx & Cash Generation Metrics
- 1.3.1 Annual CapEx and Total CapEx to Annual Revenues Ratio
- 1.3.2 Free Cash Flow & Cash Conversion
- 1.4 Competitive Advantage Metrics
- 1.4.1 Turnover Ratio & Return on Capital Employed
- Chapter 2: Satcom Market Key Indicators
- 2.1 Video & Non-Video Revenues per Operator
- Chapter 3: Individual Satellite Operator Analysis – Global Operators
- 3.1 SES Financial Performance, 2022
- 3.2 Eutelsat Financial Performance, Fiscal Year 2022/23
- 3.3 Telesat Financial Performance, 2022
- 3.4 Echostar-Hughes Financial Performance, 2022
- 3.5 Viasat Financial Performance, Fiscal Year 2022/23
- Chapter 4: Individual Satellite Operator Analysis – Others
- 4.1 Yahsat Financial Performance, 2022
- 4.2 JSAT Financial Performance, Fiscal Year 2022/23
- 4.3 Hispasat Financial Performance, 2022
- 4.4 APT Satellite Financial Performance, 2022
- 4.5 Thaicom Financial Performance, 2022
- 4.6 Spacecom Financial Performance, 2022
- Chapter 5: Individual Satellite Operator Analysis – MSS Operators
- 5.1 Iridium Financial Performance, 2022
- 5.2 Globalstar Financial Performance, 2022
- Appendix: Financial Index Definitions & Methodology
- About the authors
- About Analysys Mason
- Research from Analysys Mason
- Consulting from Analysys Mason
List of Exhibits
Ch. 1 Comparative Metrics T&C
- 2018 -2022 GEO Operator Revenues (US$ M), “Big Six” & MSS Operators
- 2018 -2022 Operator Revenues (US$ M)
- 2018 -2022 Operator EBITDA/Adj. EBITDA (US$ M)
- 2018 -2022 Operator EBITDA/Adj. EBITDA Margin
- 2018 -2022 Operator Backlog (US$ M)
- 2018 -2022 Operator Years of Backlog to Annual Revenue Ratio
- 2018 -2022 Operator Net Debt to EBITDA/Adj. EBITDA Ratio
- 2018 – 2022 Operator Total Debt to Total Assets Ratio
- 2018 – 2022 Operator Interest Service Coverage Ratio
- 2018 – 2022 Operator Annual CapEx (US$ M)
- 2018 – 2022 Operator Total CapEx to Cash Flow from Operating Activities Ratio
- 2018 – 2022 Operator Total CapEx to Annual Revenues Ratio
- 2018 – 2022 Operator EBITDA to Cash Conversion Ratio
- 2018 – 2022 Operator Free Cash Flow (US$ M)
- 2018 – 2022 Turnover Ratio
- 2018 – 2022 Return on Capital Employed
Ch.2 Sec Indicators T&C
- Video and Non-video Revenues (US$ M) per Operator
Ch.3 Global Operators T&C
- SES T&C
- SES Key Metrics, 2018 – 2022
- SES Revenues, 2018 – 2022
- SES Adj. EBITDA and Adj. EBITDA Margin, 2018 – 2022
- SES Backlog & Years of Backlog to Annual Revenues, 2018 – 2022
- SES Annual CapEx, 2018 – 2022
- SES Free Cash Flow, 2018 – 2022
- SES Total CapEx to Revenues Ratio and Total CapEx to Operating Cash Flow Ratio, 2018 – 2022
- SES Adj. EBITDA to Cash Conversion Ratio, 2018 – 2022
- SES Debt and Solvency Ratios 2018 – 2022
- SES Competitive Ratios 2018 – 2022
- Eutelsat T&C
- Eutelsat Key Metrics, FY 2018/19 – FY 2022/23
- Eutelsat Revenues, FY 2018/19 – FY 2022/23
- Eutelsat EBITDA and EBITDA Margin, FY 2018/19 – FY 2022/23
- Eutelsat Backlog & Years of Backlog to Annual Revenues, FY 2018/19 – FY 2022/23
- Eutelsat Annual CapEx, FY 2018/19 – FY 2022/23
- Eutelsat Free Cash Flow, FY 2018/19 – FY 2022/23
- Eutelsat Total CapEx to Revenues Ratio and Total CapEx to Operating Cash Flow Ratio, FY 2018/19 – FY 2022/23
- Eutelsat EBITDA to Cash Conversion Ratio, FY 2018/19 – FY 2022/23
- Eutelsat Debt and Solvency Ratios FY 2018/19 – FY 2022/23
- Eutelsat Competitive Ratios FY 2018/19 – FY 2022/23
- Telesat T&C
- Telesat Key Metrics, 2018 – 2022
- Telesat Revenues, 2018 – 2022
- Telesat Adj. EBITDA and Adj. EBITDA Margin, 2018 – 2022
- Telesat Backlog & Years of Backlog to Annual Revenues, 2018 – 2022
- Telesat Annual CapEx, 2018 – 2022
- Telesat Free Cash Flow, 2018 – 2022
- Telesat Total CapEx to Revenues Ratio and Total CapEx to Operating Cash Flow Ratio, 2018 – 2022
- Telesat EBITDA to Cash Conversion Ratio, 2018 – 2022
- Telesat Debt and Solvency Ratios 2018 – 2022
- Telesat Competitive Ratios 2018 – 2022
- Echostar-Hughes T&C
- Echostar Key Metrics, 2018 – 2022
- Echostar Revenues, 2018 – 2022
- Hughes Adj. EBITDA and Adj. EBITDA Margin, 2018 – 2022
- Echostar Fixed Broadband Subscriptions, 2018 – 2022
- Echostar Operational Expenses, 2018 – 2022
- Echostar Backlog & Years of Backlog to Total Revenues, 2018 – 2022
- Echostar Annual CapEx and Free Cash Flow, 2018 – 2022
- Echostar Total CapEx to Revenues Ratio and Total CapEx to Operating Cash Flow Ratio, 2018 – 2022
- Echostar EBITDA to Cash Conversion Ratio, 2018 – 2022
- Echostar Debt and Solvency Ratios 2018 – 2022
- Echostar Competitive Ratios 2018 – 2022
- Viasat T&C
- Viasat Key Metrics, FY 2018/19 – FY 2022/23
- Viasat Revenues, FY 2018/19 – FY 2022/23
- Viasat EBITDA and EBITDA Margin, FY 2018/19 – FY 2022/23
- Viasat Broadband and Aircraft Subscriptions, FY 2018/19 – FY 2022/23
- Viasat Operational Expenses, FY 2018/19 – FY 2022/23
- Viasat Backlog & Years of Backlog to Total Revenues, FY 2018/19 – FY 2022/23
- Viasat Annual CapEx and Free Cash Flow, FY 2018/19 – FY 2022/23
- Viasat Total CapEx to Revenues Ratio and Total CapEx to Cash Flow from Operating Activities Ratio, FY 2018/19 – FY 2022/23
- Viasat Debt and Solvency Ratios, FY 2018/19 – FY 2022/23
- Viasat Competitive Ratios, FY 2018/19 – FY 2022/23
Other Operator T&C
- Yahsat T&C
- Yahsat Key Metrics, 2018 – 2022
- Yahsat Revenues, 2018 – 2022
- Yahsat Adj. EBITDA and Adj. EBITDA Margin, 2018 – 2022
- Yahsat Backlog & Years of Backlog to Annual Revenues, 2019 – 2022
- Yahsat Annual CapEx, 2018 – 2022
- Yahsat Free Cash Flow, 2018 – 2022
- Yahsat Total CapEx to Revenues Ratio and Total CapEx to Operating Cash Flow Ratio, 2018 – 2022
- Yahsat EBITDA to Cash Conversion Ratio, 2018 – 2022
- Yahsat Debt and Solvency Ratios 2018 – 2022
- Yahsat Competitive Ratios 2018 – 2022
- Sky Perfect JSAT T&C
- SKY Perfect JSAT Space & Satellite Business Revenues, FY 2018/19 – FY 2022/23
- SKY Perfect JSAT Space & Satellite Business EBITDA and EBITDA Margin, FY 2018/19 – FY 2022/23
- SKY Perfect JSAT Space & Satellite Business Annual CapEx, FY 2018/19 – FY 2022/23
- SKY Perfect JSAT Space & Satellite Business Total CapEx to Revenues Ratio, FY 2018/19 – FY 2022/23
- Hispasat T&C
- Hispasat Key Metrics, 2018 – 2022
- Hispasat Revenues, 2018 – 2022
- Hispasat EBITDA and EBITDA Margin, 2018 – 2022
- Hispasat EBITDA to Cash Conversion Ratio, 2018 – 2022
- Hispasat Debt and Solvency Ratios 2018 – 2022
- Hispasat Competitive Ratios 2018 – 2022
- APT Corp T&C
- APT Satellite Key Metrics 2018 – 2022
- APT Satellite Revenues, 2018 – 2022
- APT Satellite EBITDA and EBITDA Margin, 2018 – 2022
- APT Satellite Annual CapEx, 2018 – 2022
- APT Satellite Free Cash Flow, 2018 – 2022
- APT Satellite Total CapEx to Operating Cash Flow & CapEx to Revenues Ratio, 2018 – 2022
- APT Satellite EBITDA to Cash Conversion Ratio, 2018 – 2022
- APT Satellite Net Debt and Solvency Ratios, 2018 – 2022
- APT Satellite Competitive Ratios, 2018 – 2022
- Thaicom T&C
- Thaicom Satellite Business Services Revenues, 2018 – 2022
- Thaicom Free Cash Flow, 2018 – 2022
- Spacecom T&C
- Spacecom Revenues, 2018 – 2022
- Spacecom EBIT and EBIT Margin, 2018 – 2022
- MSS Operators T&C
- Iridium T&C
- Iridium Key Metrics, 2018 – 2022
- Iridium Revenues, 2018 – 2022
- Iridium EBITDA and EBITDA Margin, 2018 – 2022
- Iridium Annual CapEx and Free Cash Flow, 2018 – 2022
- Iridium Total CapEx to Revenues Ratio and Total Capex to Operating Cash Flow Ratio, 2018 – 2022
- Iridium Debt and Solvency Ratios 2018 – 2022
- Iridium Competitive Ratios 2018 – 2022
- Globalstar T&C
- Globalstar Key Metrics, 2018 – 2022
- Globalstar Revenues, 2018 – 2022
- Globalstar Adj. EBITDA and Adj. EBITDA Margin, 2018 – 2022
- Globalstar Annual CapEx and Free Cash Flow, 2018 – 2022
- Globalstar Total CapEx to Revenues Ratio and Total CapEx to Operating Cash Flow Ratio, 2018 – 2022
- Globalstar Debt and Solvency Ratios 2018 – 2022
- Globalstar Competitive Ratios 2018 – 2022