NSR’s Satellite Capacity Supply & Demand, 20th Edition (SCSD20) is the industry’s most trusted and comprehensive source for satellite capacity analysis. With a proven track record of reliability and unmatched expertise, SCSD20 offers essential insights into applications, orbits, pricing, and revenue potential across 13 core regions.
As the industry undergoes a transformative phase and NGOs gain increasing influence, the revenue landscape is shifting towards data verticals, accompanied by significant changes in business and financial models. SCSD20 goes in-depth to explore these transformations, examining their competitive impact, identifying threats, uncovering opportunities, and analyzing evolving market dynamics. Our analysis is a valuable tool to navigate this ever-changing landscape and provides key considerations for achieving success.
Included in this Edition are 3 quarterly updates, which will provide fresh information and analysis on key market developments that affect market dynamics and forecast projections both on supply and demand. These could include but are not limited to:
- A launch delay or failure
- Successful or unsuccessful funding rounds
- Large capacity or customer contract announcements
- Price movements
- Regulatory developments/initiatives
Who Should Purchase this Report
- Satellite Operators
- Service Providers
- Satellite Manufacturers and Launch Providers
- Ground Equipment Manufacturers and Integrators
- Emerging Space Companies
- End Users
- Innovation and Industry Agencies
- Investment Community
- Telco’s and MNO’s
Experience the NSR Difference:
Built on 20+ years of industry expertise and collaboration, SCSD20 provides key assessments of applications, orbits, pricing, and revenue potential across 13 core regions. With thousands of data points at your disposal, you gain invaluable inputs for business planning and identifying opportunities. Our strategic insights serve as a roadmap, guiding you through the challenges posed by new players, including hyperscalers, in this emerging competitive landscape.
Table of Contents
Executive Summary
Regional Markets & Trends
- North America (NAM)
- Central America and Caribbean (CAMCB)
- South America (SAM)
- Western Europe (WEU)
- Central and Eastern Europe (CEEU)
- Middle East and North Africa (MENA)
- Sub-Saharan Africa (SSA)
- East Asia (EA)
- South Asia (SA)
- Southeast Asia (SEA)
- Atlantic Ocean Region (AOR)
- Indian Ocean Region (IOR)
- Pacific Ocean Region (POR)
List of Exhibits
Executive Summary
- Global Revenues for Leased C-, Ku- & Widebeam Ka-Band TPEs by Application
- Global Commercialized FSS Capacity Supply
- Global Revenue GEO-HTS
- Global GEO-HTS Bandwidth Supply
- Global Revenues for Leased Non-GEO HTS Bandwidth by Application
- Global Non-GEO HTS Supply Scenarios
- Global Market Share of Leased C-, Ku- and Ka-Band TPEs, 2022
- Global Market Share of Leased GEO-HTS Capacity, 2022
- 2022-32 Cumulative Video Revenues (USD Millions)
- Backhaul & Trunking Revenues
- Enterprise Data Revenues
- 2022-32 Cumulative Broadband Access Revenues (USD Millions)
- Mobility Revenues
- 2022-32 Cumulative Gov/Mil Revenues (USD Millions)
Regional Markets and Trends
NAM
- Total TPE & Bandwidth Demand
- Total Capacity Supply
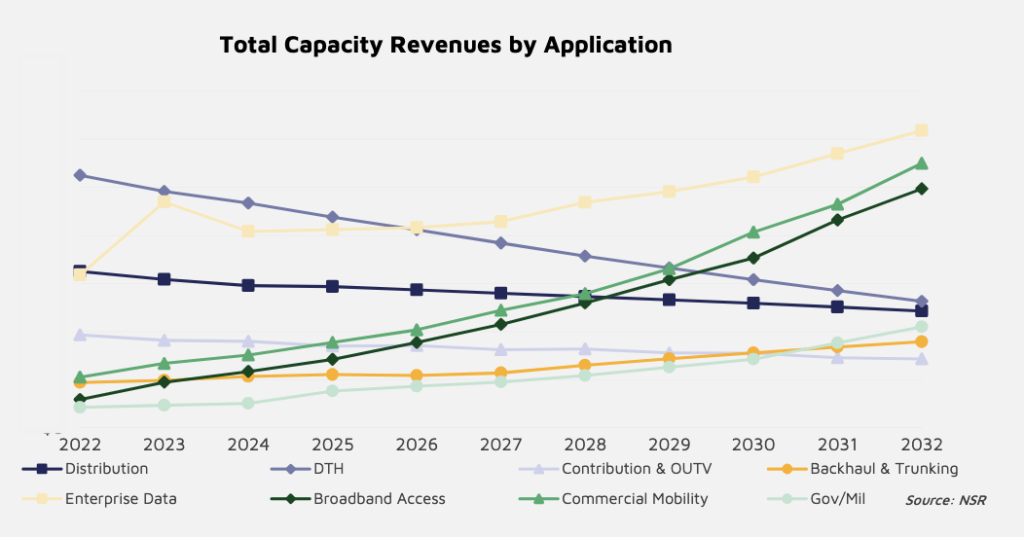
- Total Capacity Revenue by Application
- Non-GEO HTS Forecast Comparison
CAMCB
- Total TPE & Bandwidth Demand
- FSS Fill Rates
- Total Capacity Revenue by Application
SAM
- Total TPE & Bandwidth Demand
- Total Capacity Revenue by Application
- Total Capacity Supply
- Market Share of Leased C, Ku, and Ka-band TPEs, 2022
- Market Share of Leased GEO-HTS Capacity, 2022
WEU
- Total TPE & Bandwidth Demand
- Total Capacity Supply
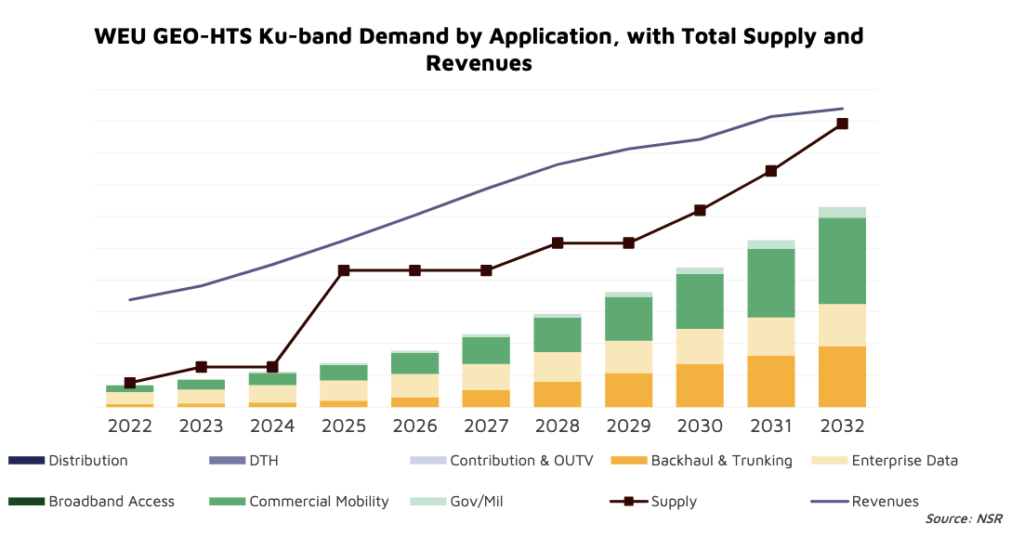
- GEO-HTS Ku-band Demand by Application, with Total Supply and Revenues
- GEO-HTS Ka-band Demand by Application, with Total Supply and Revenues
- Non-Geo HTS Demand by Application, with Total Supply and Revenues
CEEU
- Total TPE & Bandwidth Demand
- Total Capacity Supply
- Non-GEO HTS Forecast Comparison
- Total Capacity Revenue by Application
- Total Revenues (%) by Frequency
MENA
- Total TPE & Bandwidth Demand
- Total Capacity Revenue by Application
- Total Capacity Supply
- FSS Fill Rates
- HTS Fill Rates
SSA
- Total TPE & Bandwidth Demand
- Total Capacity Supply
- Total Capacity Revenue by Application
- GEO-HTS Ku-band Demand by Application, with Total Supply and Revenues
- GEO-HTS Ka-band Demand by Application, with Total Supply and Revenues
- Non-Geo HTS Demand by Application, with Total Supply and Revenues
EA
- Total TPE & Bandwidth Demand
- Total Capacity Supply
- Total Capacity Revenue by Application
SA
- Total TPE & Bandwidth Demand
- Total Capacity Revenue by Application
- Market Share of Leased C, Ku, and Ka-band TPEs, 2022
- Market Share of Leased GEO-HTS Capacity, 2022
SEA
- Total TPE & Bandwidth Demand
- Total Capacity Supply
- Total Capacity Revenue by Application
- GEO-HTS Ku-band Demand by Application, with Total Supply and Revenues
- GEO-HTS Ka-band Demand by Application, with Total Supply and Revenues
- Non-Geo HTS Demand by Application, with Total Supply and Revenues
AOR
- Total TPE & Bandwidth Demand
- Total Capacity Supply
- Total Capacity Revenue by Application
IOR
- Total TPE & Bandwidth Demand
- Total Capacity Supply
- Total Capacity Revenue by Application
POR
- Total TPE & Bandwidth Demand
- Total Capacity Supply
- Total Capacity Revenue by Application