Can LEO Broadband Truly Succeed in Developing Countries?
Shortly after SpaceX announced this year that Nigeria became the first African country to access the Starlink satellite broadband service, former president Muhammadu Buhari wrongly claimed that Nigeria’s broadband penetration had then reached 100%. In a wireless-connected world, confusion around access and connections is not uncommon but, regardless of the definitions, the story highlights the importance of factually assessing the performance of non-GEO satellite constellations at country levels, contrasting the analysis with the claims.
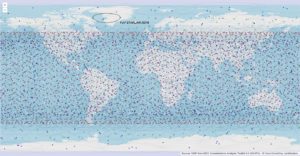
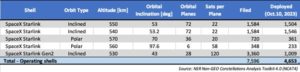
With over 4,600 operating satellites and having officially passed 2 million subscribers, Starlink now offers broadband Internet in tens of countries across all continents. This article leverages output* from NSR’s Non-GEO Constellations Analysis Toolkit version 4.0 (NCAT4) to assess Starlink performance locally, taking Nigeria as example.
Nigeria: A leading case?
Nigeria has conditions to become a leading case for the prospects of LEO broadband in developing countries:
- Size: Nigeria has the largest economy and population in Africa but carries wide infrastructure gaps that constrain access to key services, including fixed and wireless connectivity.
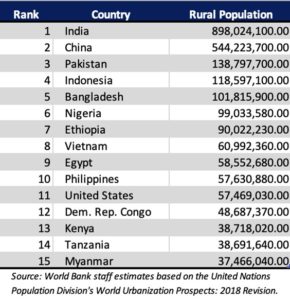
- Rural Population: With a rural population of over 99 million people (ranked 6th worldwide), Nigeria is an obvious candidate for satellite broadband.
- Slow Speeds: Even areas with broadband access show slow internet speeds that affect over half of the users, according to sources.
- Aggressive National Broadband Plan: The Nigerian National Broadband Plan seeks to raise the nation’s broadband penetration from around 48% in 2023 (all technologies) to at least 90% by 2025.
Despite the virtues of satellite broadband, affordability remains a barrier to widespread adoption in Nigeria (reason why Starlink recently lowered the price) but given the government target and current state, it will be challenging for Nigeria to achieve its broadband goals without the support of satellite broadband. At this point the key question is: Even ignoring affordability constraints, how far can Starlink go in terms of serving rural broadband users in Nigeria, either directly or via backhaul means?
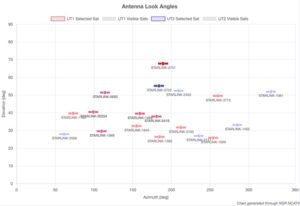
Visible Starlink satellites
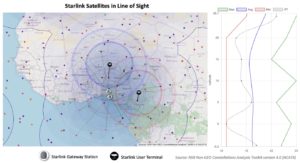
Given different shell altitudes, orbital inclinations and look angle requirements for user terminals (UT), the “visibility cones” vary as shown. Based on NCAT4 calculations, there are 11 to 25 satellites in line of sight from any location in Nigeria and 16 on average. This drops below 10 when considering only satellites with single-hop connectivity to one of the two Starlink gateway stations in Nigeria. Yet, this number still provides the Starlink orchestration system with ample room for optimization (and for GEO arc interference avoidance). Plus, a large portion of the satellite fleet counts with optical inter-satellite links (OISLs) so user Internet traffic may travel in space to land in one of the ground stations in Nigeria, Europe or elsewhere.

Dynamic IP Bandwidth Supply & Demand Analysis
The NCAT4 IP throughput and heatmap tools allow granular, multi-orbit and country-level estimations of constellations’ supply and demand of capacity. NCAT runs millions of real-time calculations of beam capacity steered to the target areas. The throughput tool calculates capacity on every user and gateway beam and across a wide range of gateway and user look angle combinations. This data then allows NCAT to dynamically drive supply-demand “heat map” analysis on hexagonal ground cells that are configurable down to city-size precision as showcased in this article.
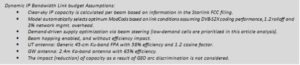
For the target market, the analysis assumes rural areas with a population density between 0.1 and 300 inhabitants per square kilometer. This results in 106 million inhabitants. Simulation then assumes a capture of 1%, thus 1.06 million people connected to the Starlink system either directly or via MNO/telco backhaul. An end-user broadband service plan of 25/5 Mbps with 40-to-1 oversubscription is assumed, resulting in 665 Gbps of downstream demand for the country.
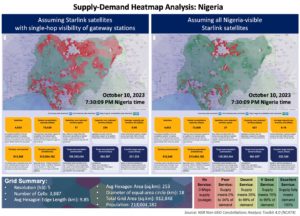
Given the listed assumptions, a 1-hour simulation starting at 7 PM Nigeria time (accelerated 60 times) led to the following conclusions for the two heatmap scenarios:
- Assuming satellites with single-hop connectivity to Nigeria gateway stations: 48% of the traffic volume demanded in one hour was carried by the system (throughput varies with satellites moving and aggregate speed can be lower or lower at times).
- Assuming all satellites visible from the Nigeria territory (ignoring gateway connectivity): The system was able to carry 83% of demanded traffic volume.
The difference between the two scenarios is not surprising as it is a direct result of scenario 2 roughly doubling scenario 1 in terms of usable satellites. The distribution of “red” and “green” grid cells changes as satellites move but given the simulation settings, steerable beams attempt to satisfy low-demand cells first to avoid bandwidth starving.
The Bottom Line
This exercise illustrates how challenging it can become for developing countries to close digital-divide gaps by relying exclusively on satellite broadband but, perhaps more importantly, it shows that in countries like Nigeria, there is room for multiple satellite competitors as even large players can find constraints in meeting the demand of one percent of the target user base. Broadband access is a necessary but not sufficient condition to meet connections’ needs.
NSR’s Non–GEO Constellations Analysis Toolkit 4.0 (NCAT4) is an assembly of quantitative models that x-ray and benchmark LEO and MEO satellite constellations. The latest edition of NSR’s industry-leading benchmarking toolset has moved online bringing expanded capabilities and processing power. Users can assess the impact of constellations dynamically, across both space and time domains, and with finer resolution and speed than previous spreadsheet versions.
* Contact NSR if you want to learn more about NCAT4 or if you would like to receive this article simulation data in CSV tabular format.